Campaign or referral
The original source and landing context enter with the session.
Case study / Analytics platform
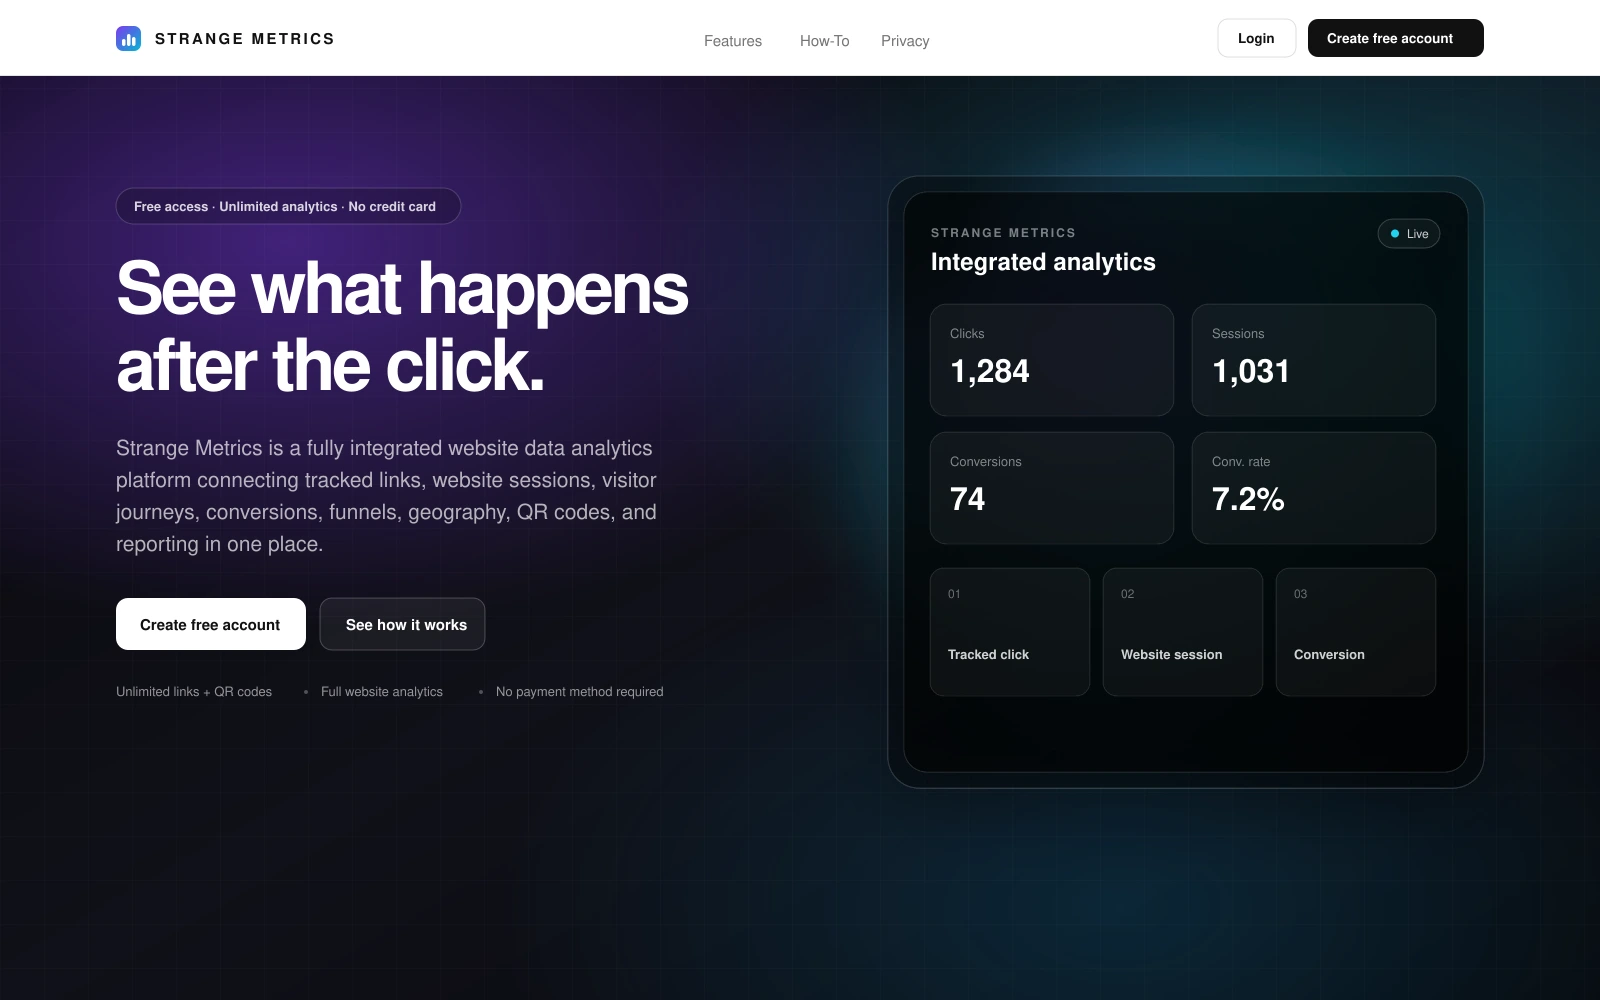
A first-party analytics platform designed to connect website activity, campaigns and meaningful customer actions in one clear view.
The opportunity
Website owners can often see that visits happened without clearly understanding which campaigns, links, pages and customer actions created genuine opportunities.
Strange Metrics is being built as a measurement layer that Grove & Gauge can integrate directly into client websites. The original link stays intact while the website records the session context and events that matter to the business.
The original source and landing context enter with the session.
Page and interaction events reveal how the experience is used.
A form, call, download or other useful outcome is recorded.
The business sees the path from attention to measurable action.
What is being built
Strange Metrics combines a direct integration layer with the reporting and account structure needed to serve multiple businesses.
Measurement is installed within the client website, so campaign and destination links can remain clean, direct and on-brand.
UTM parameters, referrers and landing pages help explain where attention came from and what brought it to the site.
Session activity, device context and approximate location data create a more useful picture of how people use the experience.
Forms, calls, downloads, outbound links and other business actions can be defined and measured as conversion events.
Clear reporting brings traffic, sources and conversion activity together without making business owners interpret raw event logs.
The platform is being structured to keep each company and website separate while supporting centralized onboarding and management.
Technical foundation
The architecture is designed so each business can access its own projects and reporting while Grove & Gauge can manage onboarding from one product foundation.
A responsive product interface for site setup, reporting and day-to-day analytics review.
Structured projects, sessions and events with account-aware access controls.
A direct connection between each client website and its corresponding analytics project.
Product progress
The tracking foundation and client dashboard architecture are being developed now. Site onboarding, reporting depth and guided provider installation will continue to expand as the platform moves toward client use.
Need clearer website reporting?
A useful analytics setup begins with the decisions your business needs to make—not with collecting every possible data point.
Ask Us a Question